PV Dashboard: Easy energy flow monitoring
Making my daily tasks easier and creating tools that will save my time is one of my many hobbies. In this entry, I want to present my new tool called „PV Dashboard”.
What is it, you might ask? Simple, easy-to-read Grafana dashboard, which integrates data from multiple sources using NodeRED and InfluxDB.
The most interesting and time-consuming thing in this setup was gathering data from the SolarEdge inverter and Tauron eLicznik (energy meter).
PV Dashboard, what is it?
After getting PV installation and energy meter provided by the power company I wanted to know how many kWh is directly consumed in the house, send to the grid, or taken from the grid.
Before creating this tool I need to check energy production on the SolarEdge website:

After that check energy production on Tauron eLicznik website:
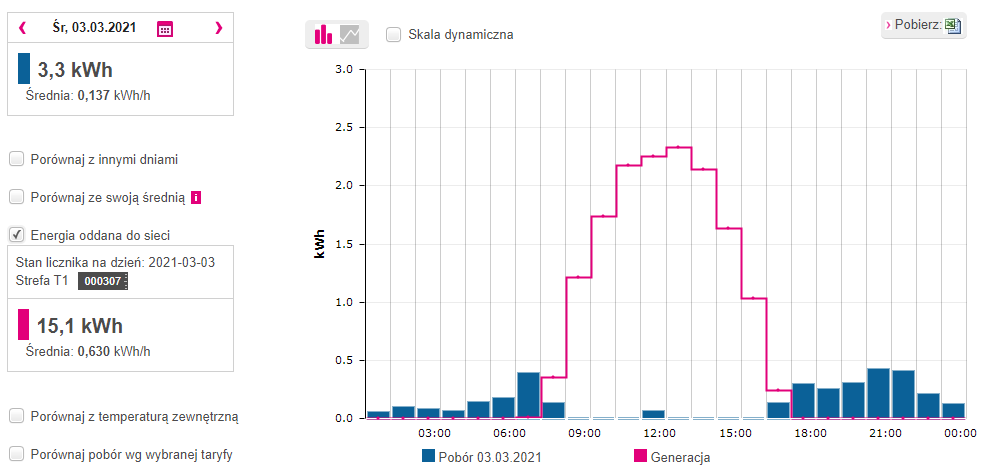
And of course make the calculation: 16,64 – 15.1, so I directly consumed 1,54 kWh on this day.
Why it’s easier to use Grafana dashboard?
I pick the date range on the Grafana dashboard, and everything is magically calculated. On the bottom left you can see energy production (green), energy consumption (red), energy send to the grid (yellow), energy directly consumed (blue).
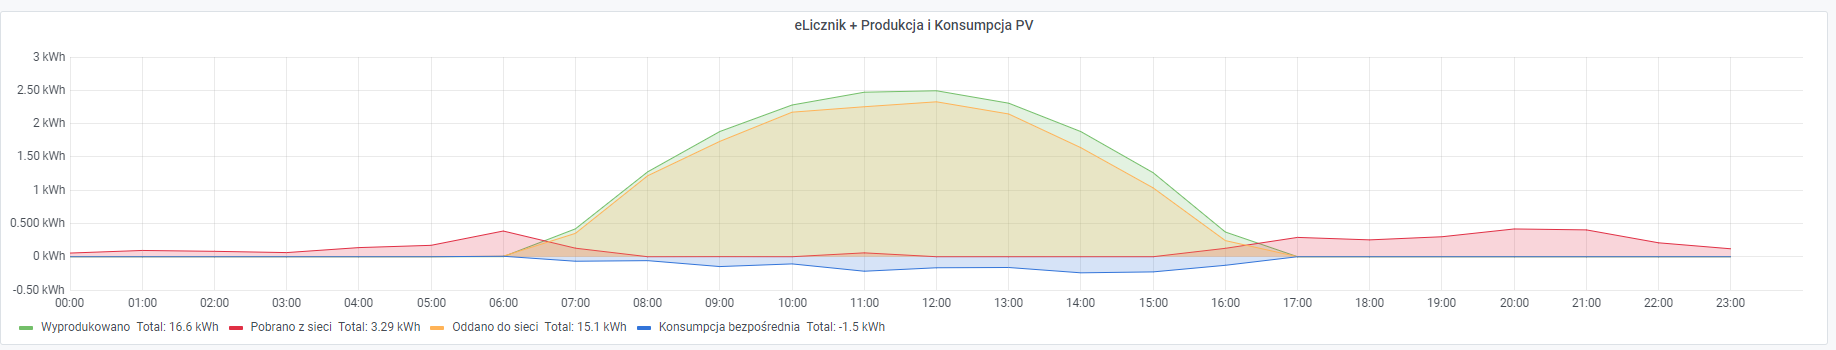
The greatest thing is that I can pick any hour and get detailed data as it’s shown below:

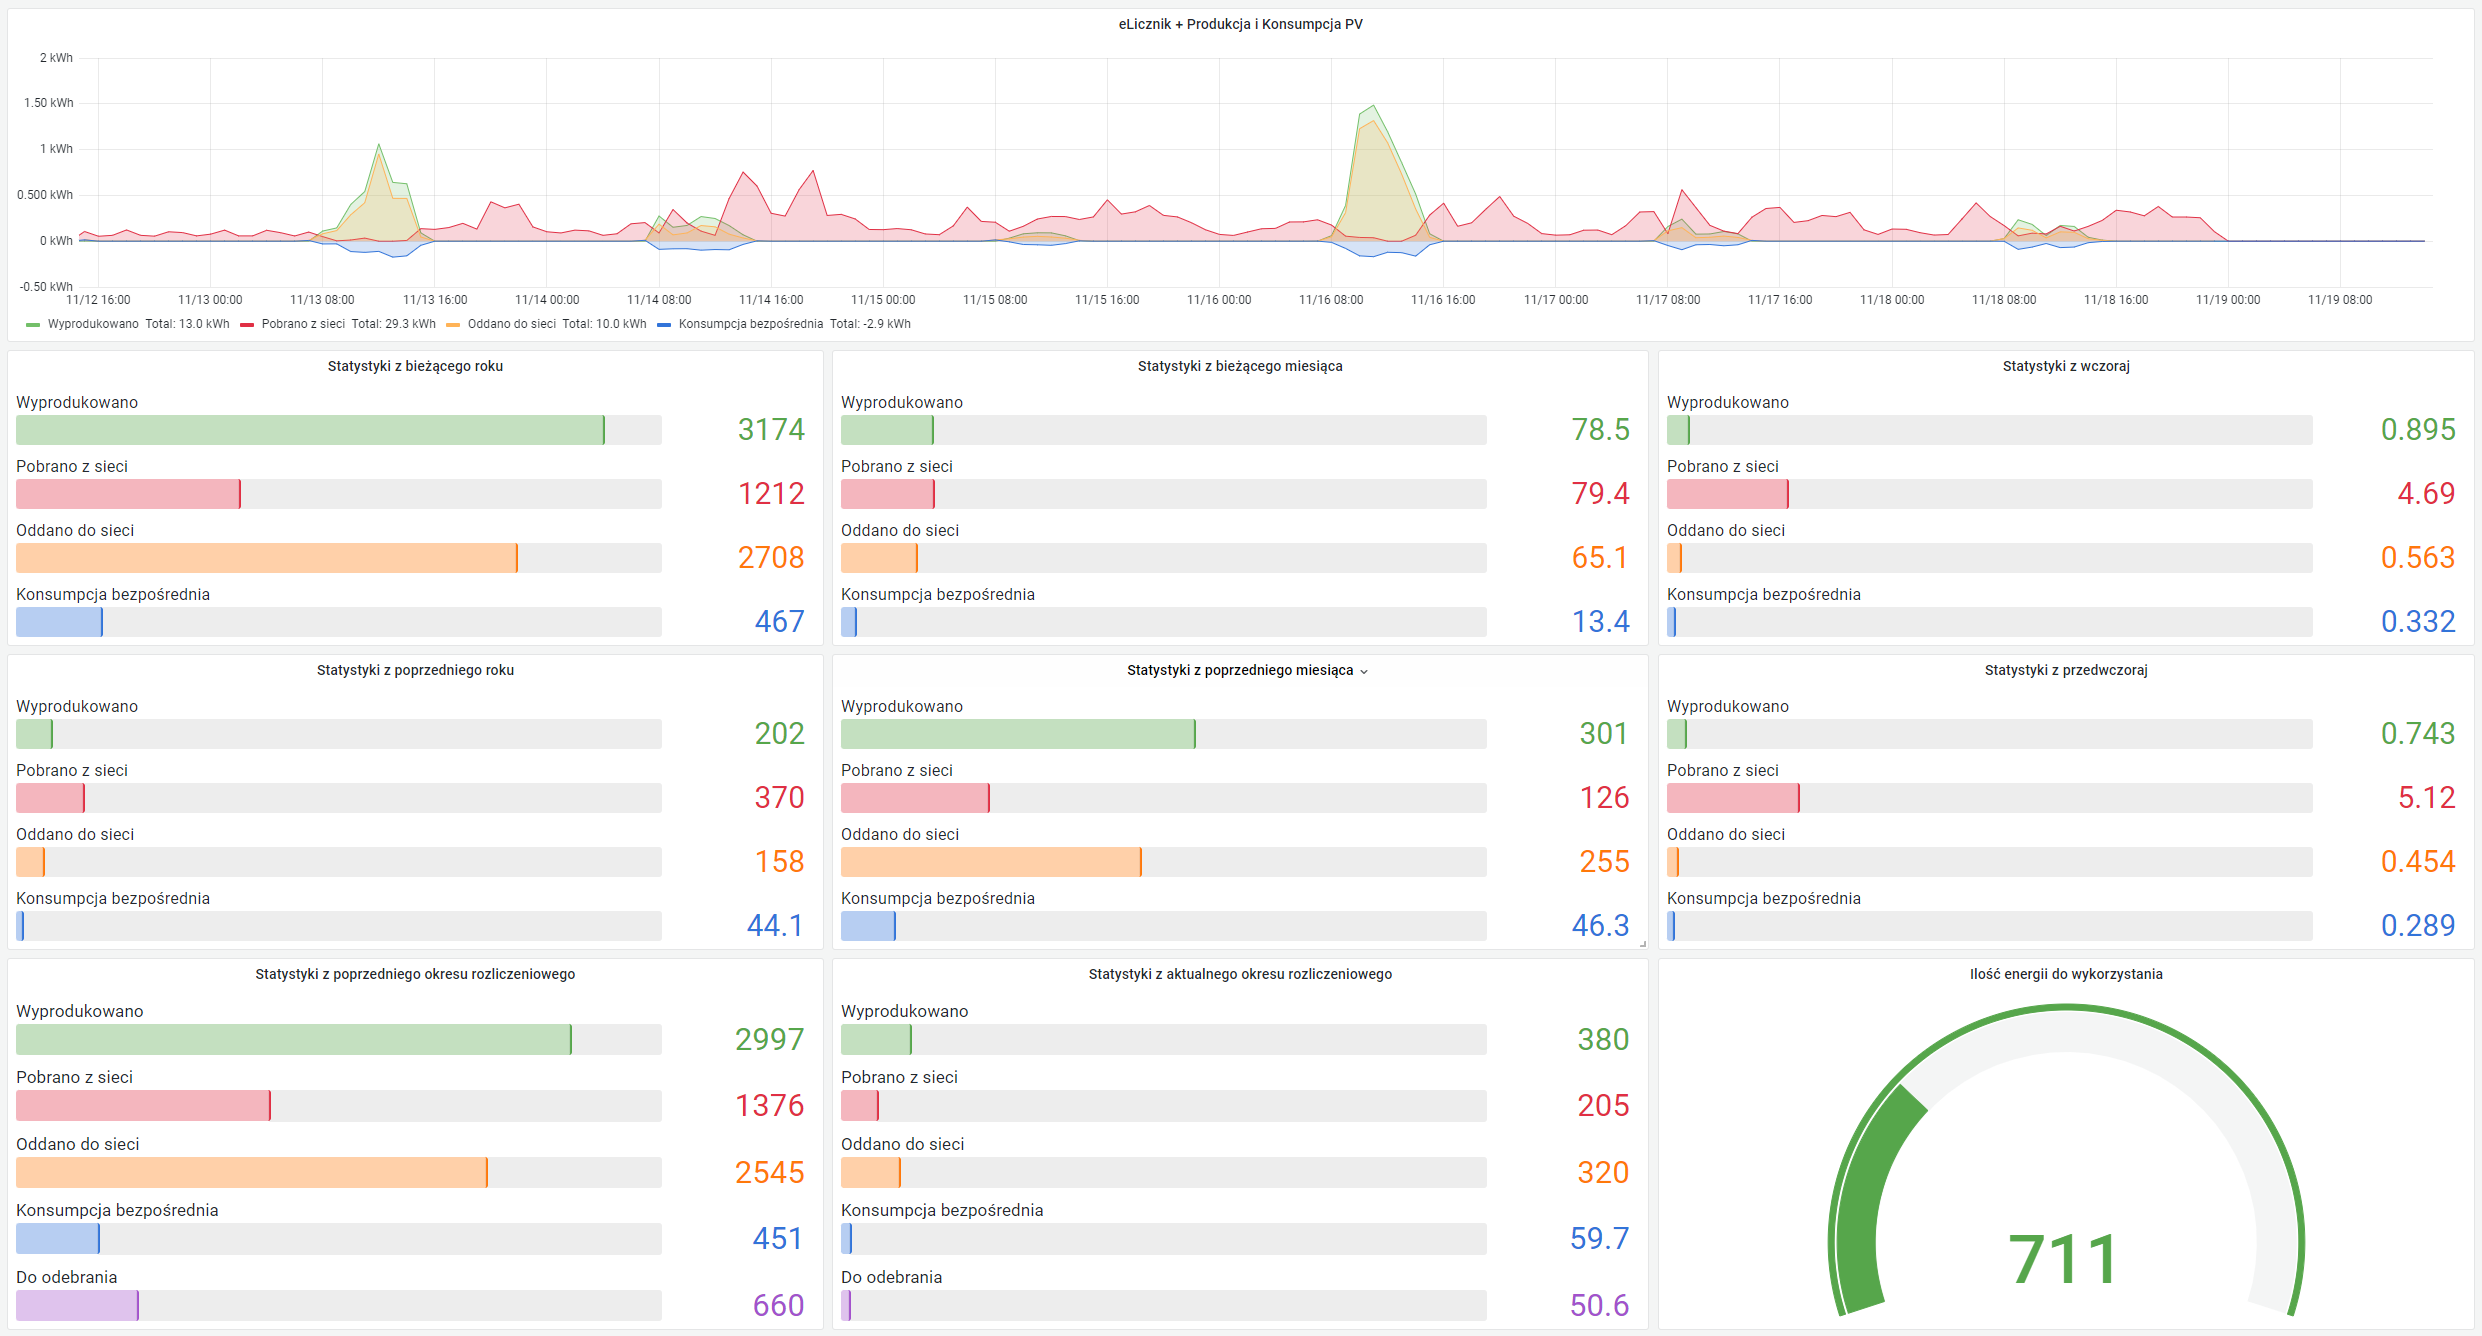
Also, you can see multiple days and other predefined time ranges:
How is it done?
There are two jobs created in NodeRED. One for getting measurements from SolarEdge every hour from 6 to 22, and the second one for getting data from the energy meter once a day (data from the prior day is available the next day at 8-9 in the morning).
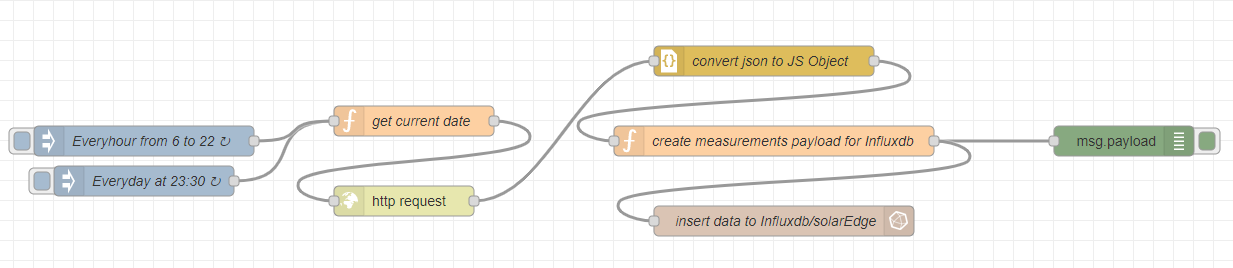
Below you can see the SolarEdge job that is triggered every hour. Next in the JavaScript function data for the HTTP request is formatted. After making a SolarEdge API call measurements are transformed from JSON to JS Object. In another function written in JavaScript, I’m creating input data in InfluxDB structure. The next step is an only formality, inserting measurements into the database.
Tauron eLicznik job is very similar but triggered only once a day. In this scenario, I get a prior date and format it to match the python script input pattern. I’ve used a script written by Michał Zaniewicz, but I lightly modified it to match my flow. The next steps are the same, of course, parsing measurements data is done differently, but the resulting structure is the same.

How is it hosted?
The easiest and fastest way was creating Docker Compose with multiple containers. Firstly I create a container based on the node-red image with additional node modules required by my NodeRED flows and also with my python script with all dependencies. Other images are untouched InfluxDB, Chronograf, and Grafana. I don’t know why I included Chronograf, for me, it’s so complicated and all InfluxDB operations were done through the command line :)
The last component is Nginx used as load balancer/proxy and of course, all DNS requests are filtered by Cloudflare and handled on Oracle Cloud free VPS.
version: '2'

services:
  node-red:
    build:
      context: .
      dockerfile: node-red.Dockerfile
    environment:
      - TZ=Europe/Warsaw
    ports:
      - '1880:1880'
    volumes:
      - node-red-storage:/data

  influxdb:
    image: influxdb:latest
    ports:
      - '8086:8086'
    volumes:
      - influxdb-storage:/var/lib/influxdb
    environment:
      - INFLUXDB_DB=eLicznik; CREATE DATABASE solarEdge;
      - INFLUXDB_ADMIN_USER=${INFLUXDB_USERNAME}
      - INFLUXDB_ADMIN_PASSWORD=${INFLUXDB_PASSWORD}

  chronograf:
    image: chronograf:latest
    ports:
      - '8888:8888'
    volumes:
      - chronograf-storage:/var/lib/chronograf
    depends_on:
      - influxdb
    environment:
      - INFLUXDB_URL=http://influxdb:8086
      - INFLUXDB_USERNAME=${INFLUXDB_USERNAME}
      - INFLUXDB_PASSWORD=${INFLUXDB_PASSWORD}
      - BASE_PATH=/chronograf

  grafana:
    image: grafana/grafana:latest
    ports:
      - '3000:3000'
    volumes:
      - grafana-storage:/var/lib/grafana
      - ./grafana-provisioning/:/etc/grafana/provisioning
    depends_on:
      - influxdb
    environment:
      - GF_SECURITY_ADMIN_USER=${GRAFANA_USERNAME}
      - GF_SECURITY_ADMIN_PASSWORD=${GRAFANA_PASSWORD}

volumes:
  node-red-storage:
  influxdb-storage:
  chronograf-storage:
  grafana-storage:
Summary
I hope that this entry inspires you to make your life easier and automate requiring tasks. If you have any questions let me know in the comment section or on another communication channel.
Don’t hesitate and make a programmer move :D